How Much Did You Pay?
Published on November 22, 2022, Updated on June 27, 2023 By Tim McMahon
Historical Gasoline Prices in Pictures–
I thought it would be fun to look at some pictures of gasoline prices in days gone by. Of course, we have to remember that salaries were much lower in those days as well. Inflation doesn’t affect all prices equally. Let’s look at how Gasoline Prices and Wages relate since the 1920s.
In 1924 my grandfather probably paid around 21 cents a gallon for gasoline. The average wage was about 62.6¢/hour. But that was just the average, a unionized carpenter in Boston would have made a whole Dollar an hour.
Gasoline Prices and Wages in the 1930s
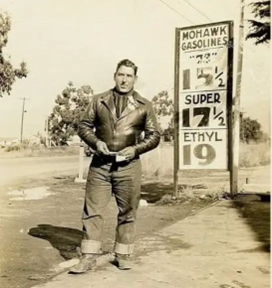
Imagine paying 15½ cents for a gallon of gasoline. The only time gasoline prices were anywhere near this low was in the 1930s.
The average wage for a “common laborer” in 1931 was 41.2¢ per hour, but on the low end, some only made 10¢ per hour, meaning the lowest paid laborer would have to work an hour and a half to get 1 gallon of gasoline. But then again, in those days, the lowest-paid laborers wouldn’t have anything to put gas in, since they couldn’t afford a car either. At 17¢/gallon, the average laborer would have to work just under 25 minutes to buy a gallon of gasoline.
Gasoline Prices and Wages in the 1950s
By 1950 the average price of gasoline had increased to 27¢/gallon. The average annual income was only $2,000/year or $38/week, so it was less than $1/hour. So, a gallon of gasoline would cost the average worker about 17 minutes of labor.
In January of 1950, the Federal minimum wage was raised to 75¢/hr. so a minimum wage worker would take 21.6 minutes to earn a gallon of gasoline.
Gasoline Prices and Wages in the 1970s and 80s
Throughout the 1970s, gasoline had steadily climbed from 36¢/gallon in 1970 to 88¢/gallon in 1979. And for the first time in the history of the U.S., gasoline costs more than $1.00 in 1980. It averaged $1.35 in 1981.
The average annual wage in 1981 was $15,432, so despite the massive run-up in the price of gas, the average worker only had to work less than 10 minutes to buy a gallon of gas. In January of 1981, the minimum wage was raised to $3.35. So, a minimum-wage worker would have to work just under 24 minutes to earn a gallon of gasoline.
Gasoline Prices and Wages in the 1990s
The 1990s were good times for the price of gasoline, prices were stable and relatively low. They began the decade at $1.12/gallon in 1990 and ended the decade at $1.12/gallon in 1999! According to the U.S. Bureau of Labor Statistics, the average annual pay was $25,903 in 1992. So, in 1992, the average worker earned about $12.45 an hour.
Therefore, it only took a little over 5 minutes of work to buy a gallon of gas for the average wage earner in 1992. The federal minimum wage was raised to $4.25 in April of 1991. So, a minimum wage earner would take only a little over 15 minutes to earn a gallon of gas.
Gasoline Prices and Wages in the 2000s
Gasoline prices rose rapidly in the new millennium, jumping to $1.46 in 2000 and then to $1.81 in 2004. In 2008 gas prices first broke above $3.00/gallon, averaging $3.22 for the year. According to the Bureau of Labor Statistics, individuals earned an average of $15.57 per hour or $32,390 per year in 2008. So, at $3.22 per gallon, the average individual in the U.S. would have to work 12.4 minutes to buy a gallon of gas.
In July of 2008, the minimum wage was raised to $6.55. so the average minimum wage worker would have to work almost a half hour to buy a gallon of gas.
Gasoline Prices and Wages in 2019 to 2022
The average cost of Gasoline in 2019 was $2.50/gallon. The average income of all professions in 2019 was $27.86. The minimum wage was $7.25 and had been since 2009. So, the average worker only had to work 5.83 minutes to buy a gallon of gas, while the minimum wage worker had to work 20.68 minutes.
The average cost of Gasoline rose to 2022 was $3.80/gallon. The average income of all professions was $29.76. The minimum wage was still $7.25. The average worker had to work slightly longer at 8.86 minutes to buy a gallon of gas, but the minimum wage worker had to work 31.45 minutes.
Though the price of a gallon of gasoline has changed dramatically over the last 100 years, it remains a necessity for Americans of all income levels. It is interesting to look back to see, not only what we’ve paid through the years, but also how we’ve earned it as we continue to drive into the future.
SOURCE: Edited with permission from inflationdata.com/articles/2022/11/22/gasoline-prices-vs-wages-over-time/

